Set Theory
I am eccentric
deliberately on purpose.
I sit within my circle
of circles
creating graphs
and pie charts
to demonstrate
and prove my theories.
Flywheels, hoops
and spinning wheels
toothed cogs and gears
all circles,
mine when I’m within them
territorially.
I am the master
of concentricity,
I overlap with anything,
everything before I’m through.
There was One before me
making claims somewhat like mine,
but he has conceded.
I have no competition
as far as I can see.
All of my horizons
are round within a skyline,
protecting me.
I’m safe within my center,
containing centers
the core of which is me.
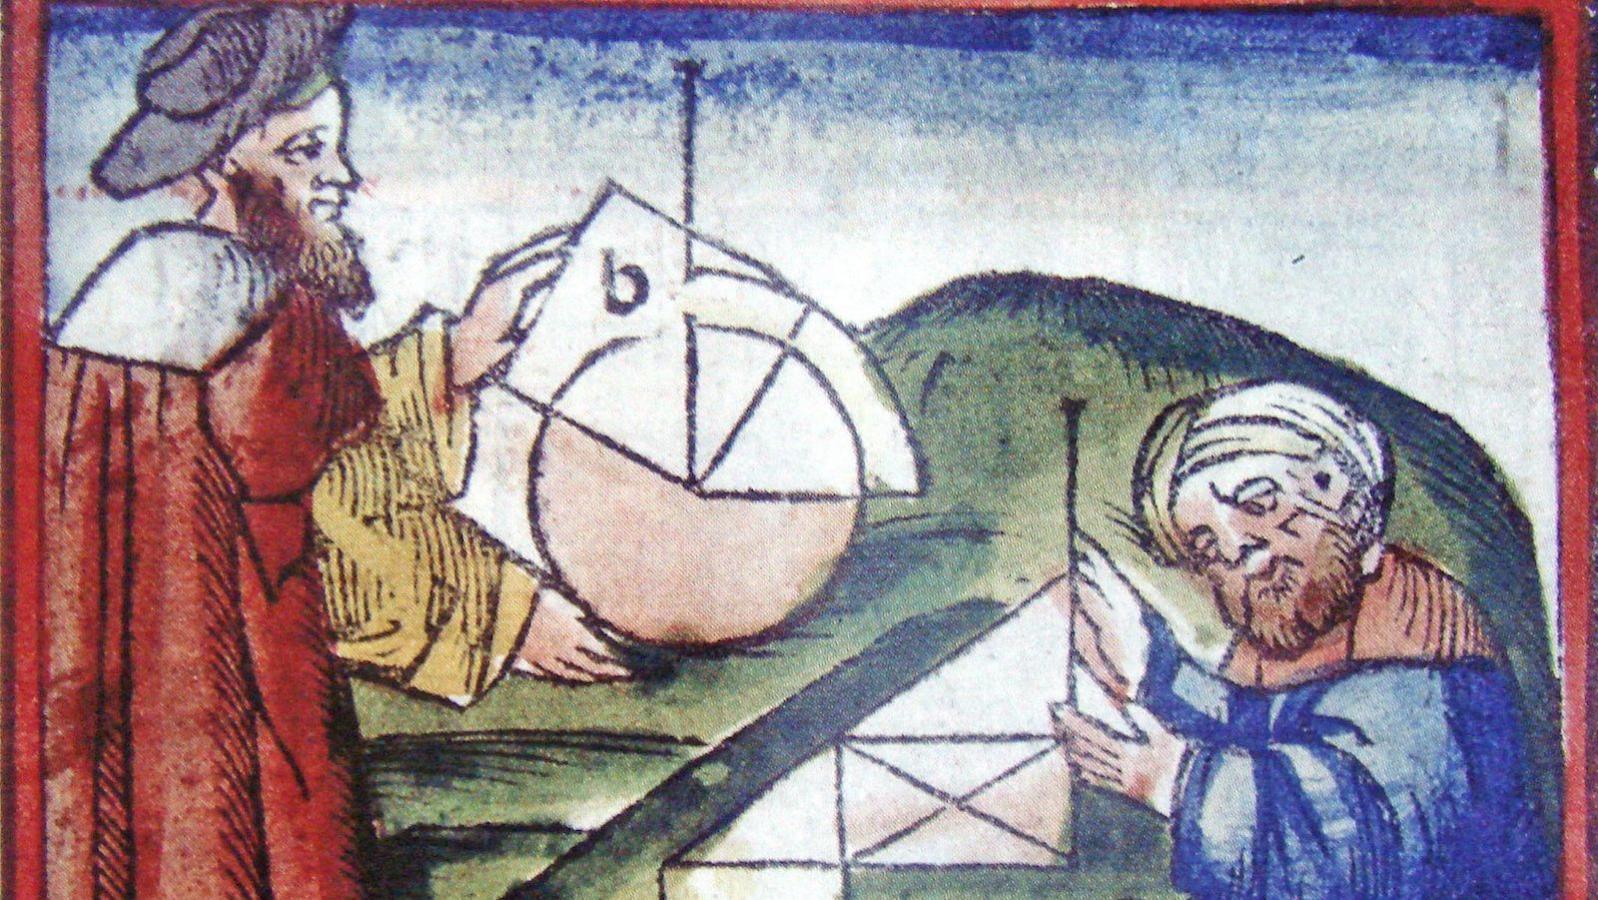
Westerner and Arab Practicing Geometry (ca. 15th Century)
I am eccentric
deliberately on purpose.
I sit within my circle
of circles
creating graphs
and pie charts
to demonstrate
and prove my theories.
Flywheels, hoops
and spinning wheels
toothed cogs and gears
all circles,
mine when I’m within them
territorially.
I am the master
of concentricity,
I overlap with anything,
everything before I’m through.
There was One before me
making claims somewhat like mine,
but he has conceded.
I have no competition
as far as I can see.
All of my horizons
are round within a skyline,
protecting me.
I’m safe within my center,
containing centers
the core of which is me.
Westerner and Arab Practicing Geometry (ca. 15th Century)
With his "Chart of Biography" (1765) and then especially "A New Chart of History" (1769) Joseph Priestley invented the timeline chart with individual bars to compare "the rise, progress, extent, duration, and contemporary state of all the considerable empires that have ever existed in the world." Inspired by Priestley's innovation (and by his own brother John, a mathematics professor at Edinburgh University, who showed him that "whatever can be expressed in numbers, may be represented by lines") William Playfair, a failed silversmith who had patented the 1st mass-produced silverplated spoon (and who had worked closely with Andrew Meikle, the inventor of the drum threshing machine, and James Watt, the inventor of the steam engine) created the bar chart to show Scottish imports and exports with 17 other areas as part of "The Commercial and Political Atlas: Representing, by Means of Stained Copper-Plate Charts, the Exports, Imports, and General Trade of England, at a Single View. To which are Added, Charts of the Revenue and Debts of Ireland" in 1786. The book also contained 43 time-series graphs, the world's 1st line and area charts, and Playfair bragged that he was “the first who applied the principles of geometry to matters of Finance." His book attracted the attention of Louis XVI, who said Playfair's charts "spoke all all languages," and so the net year he relocated to France, where he developed a new method of rolling steel and participated in the storming of the Bastille (which precipitated the French Revolution) in 1789, but he returned to London after narrowly avoiding arrest by the revolutionary government due to his leading role in the Scioto land swindle of 1789. In 1793 he learned about the invention of the semaphore telegraph and sent a model to the duke of York, claiming to have been its inventor; he did, however, introduce a new alphabet for the device. Then he opened a failed Security Bank and, after the UK went to war against France, counterfeited and distributed 100 million assignats in 1793, causing the French currency to become worthless by 1795, undermining the Jacobin "reign of terror" and the Directoire which replaced it. Playfair was involved in a series of unsuccessful ventures, including journalism, blackmailing a Scottish lord, and extortion, and he was convicted of swindling in 1805. He devised both the pie chart and the circle graph for his "Statistical Breviary; Shewing, on a Principle Entirely New, the Resources of Every State and Kingdom in Europe" (1801). In the year he was imprisoned he published "An Inquiry into the Permanent Causes of the Decline and Fall of Powerful and Wealthy Nations," in which he argued that that national decline can be measured and thus prevented by maintaining commercial prosperity, managing the national debt, and promoting a trade surplus; the book included updated versions of his earlier graphs plus one that spanned 3 millennia and showed the comparative progress and decline of Western empires. That year he also produced the 1st critical edition of Adam Smith's 1776 pioneering economics treatise "An Inquiry into the Nature and Causes of the Wealth of Nations." He returned to France after Napoleon's fall and edited "Galignani’s Messenger" but was prosecuted for libel in 1818 and fled to avoid imprisonment. He spent his remaining years writing pamphlets and translations and combined line graphs, bar charts, and chronological diagrams into single illustrations. The founder of graphical methods of statistics died in 1823 at 64.
ReplyDelete